
Spreadsheets are not just for accounting, statistics, or business anymore. Microsoft Excel has amazing Geography and Charting Functions that can be integrated into a Geography Curriculum. The Excel lessons here require the full versions of Excel for Microsoft 365 or Excel for Microsoft 365 for Mac. The screenshots are from a Mac, Windows will look very similar.
While it is certainly easy to look up the population of any Country, what if your students could quickly research the population of 194 Countries instantly? The Capitol Cities? How about a list of almost 50 data points to choose from? Then create an interactive Geo-Chart?
This can easily be done in Excel. For this post I am including an .xlsx spreadsheet with a list of 194 Countries that you may use for your class. This list was provided by https://www.thespreadsheetguru.com/blog/list-countries-capitals-abbreviations
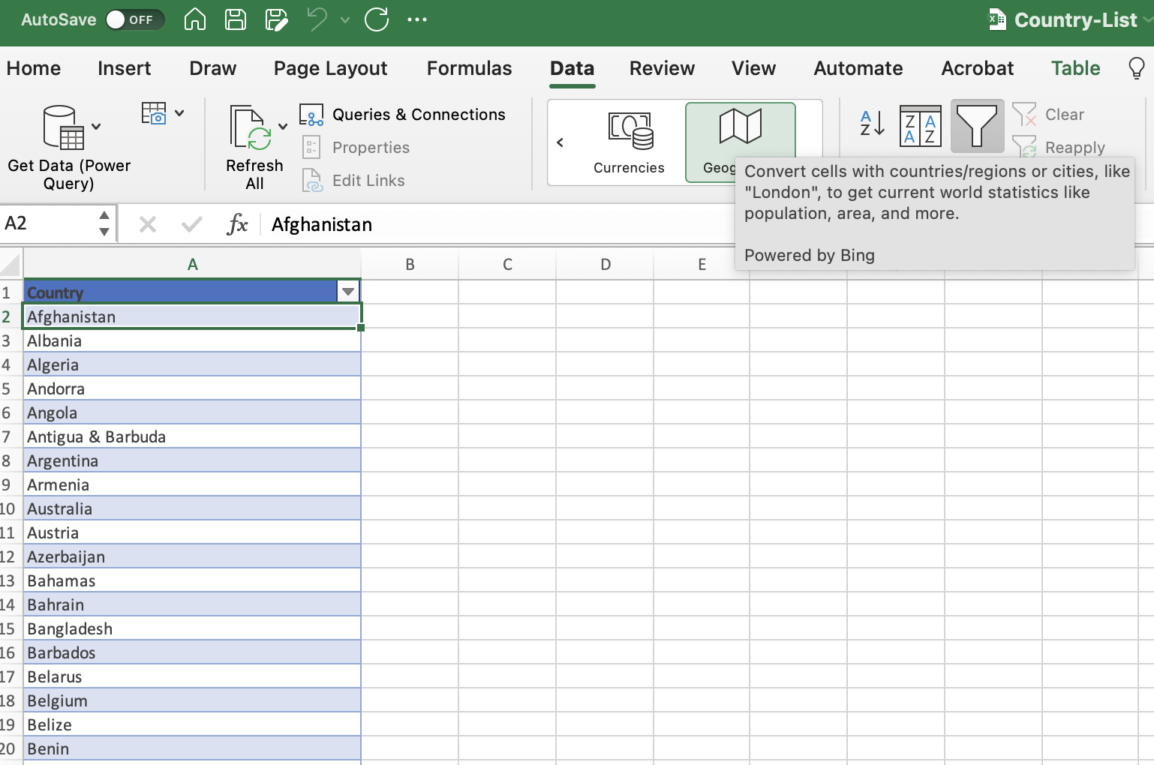
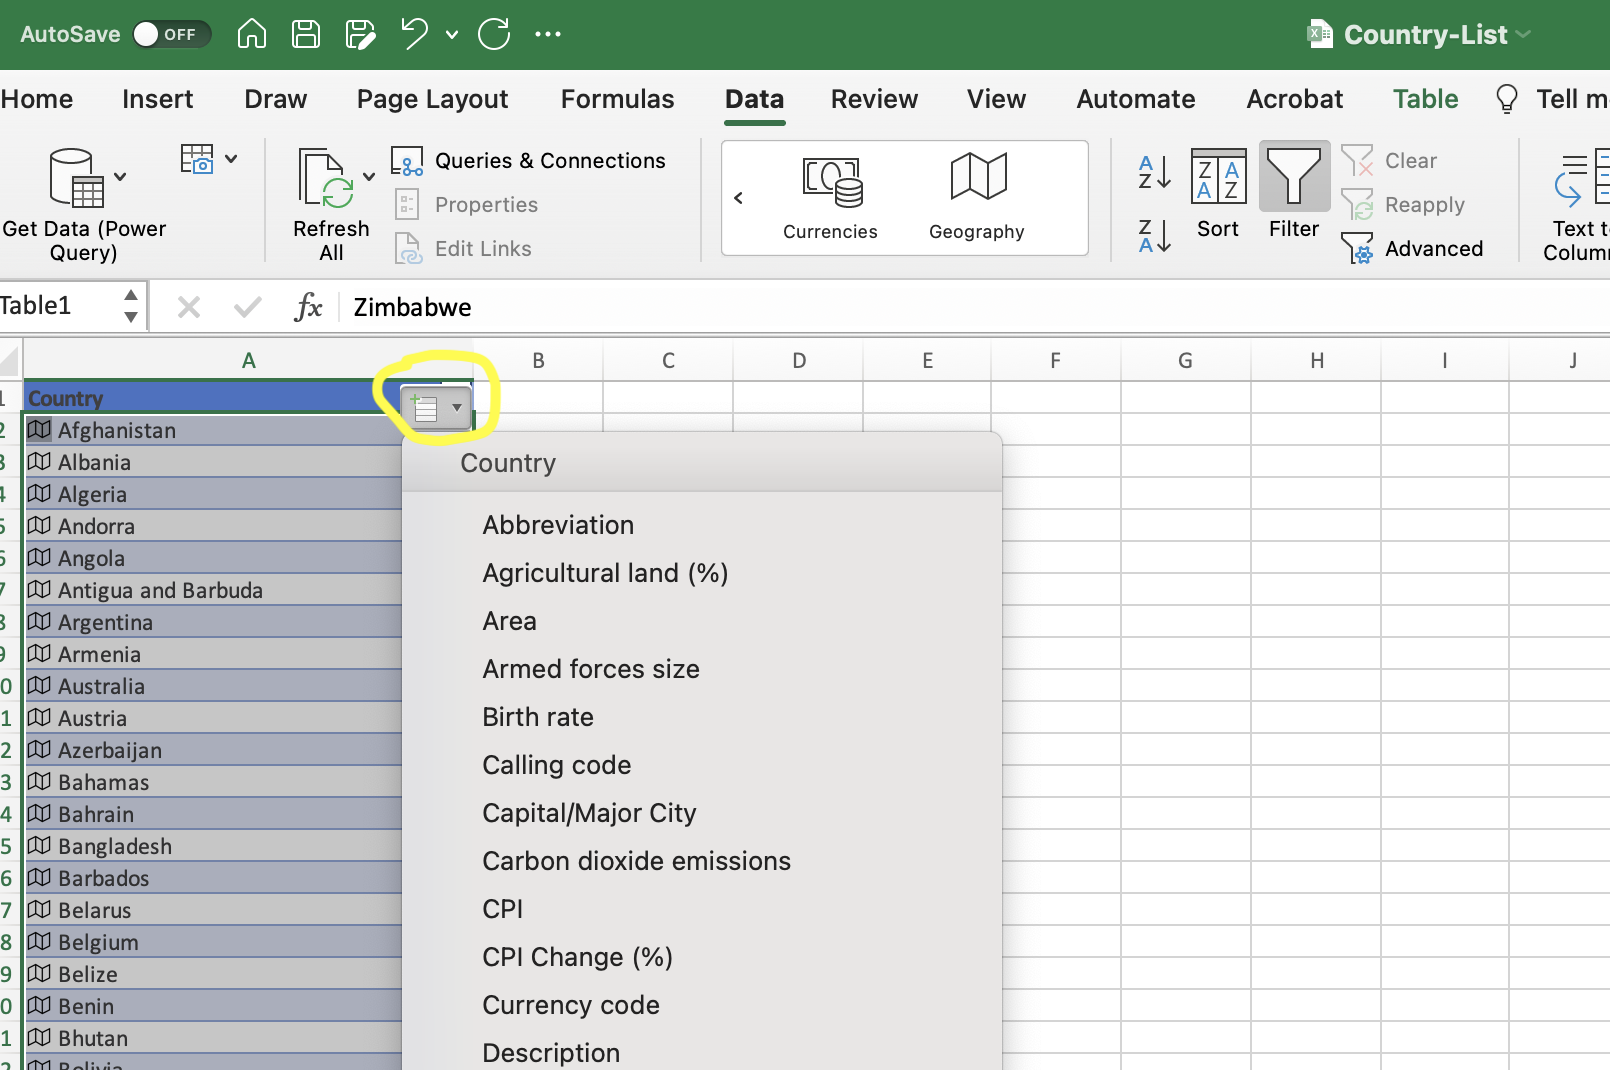
When you open the above file, select the entire list of Countries so that they are all highlighted. From the menu select Data, then Geography. There will be a slight delay because of the length of the list, but you will soon see the Geography data symbol to the left of each Country, and a small menu icon at the top. Drop that menu down and select population, or any other data point relative to your Geography Lesson Plan.
After you select the data point, a new column will appear with the results. In this example we chose population. The results should look like this image, you may need to adjust the column width to see all the results:
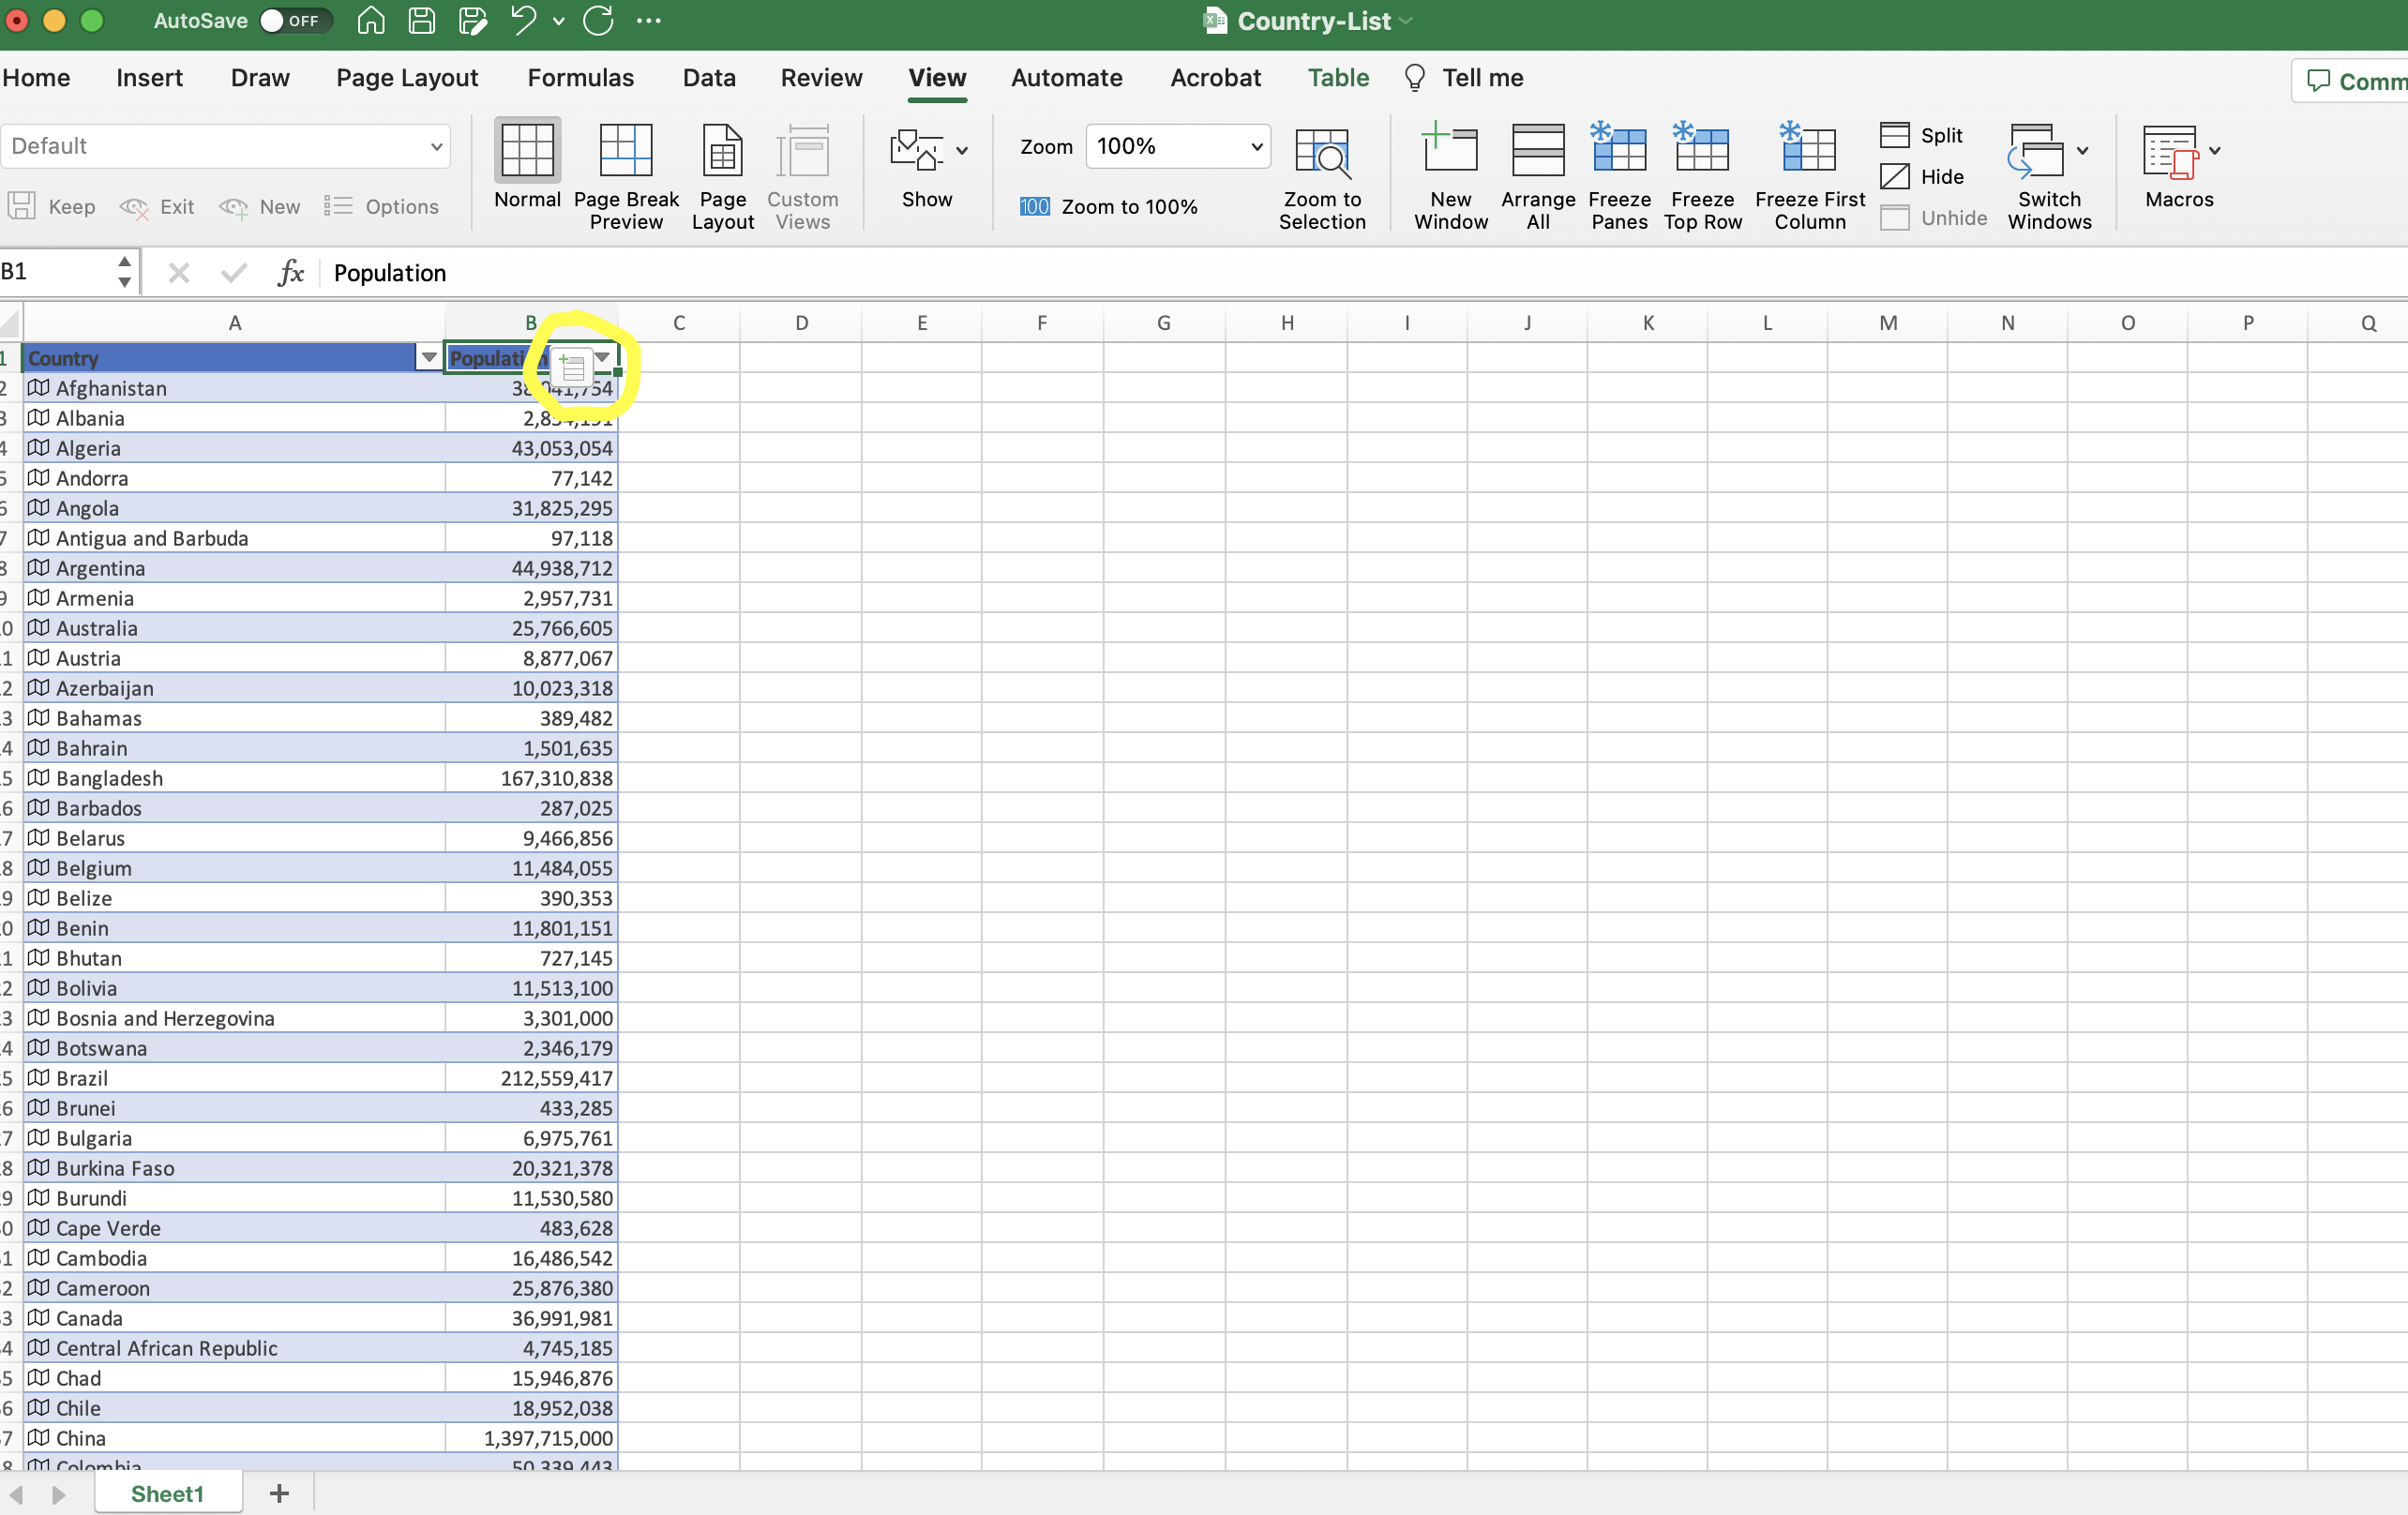
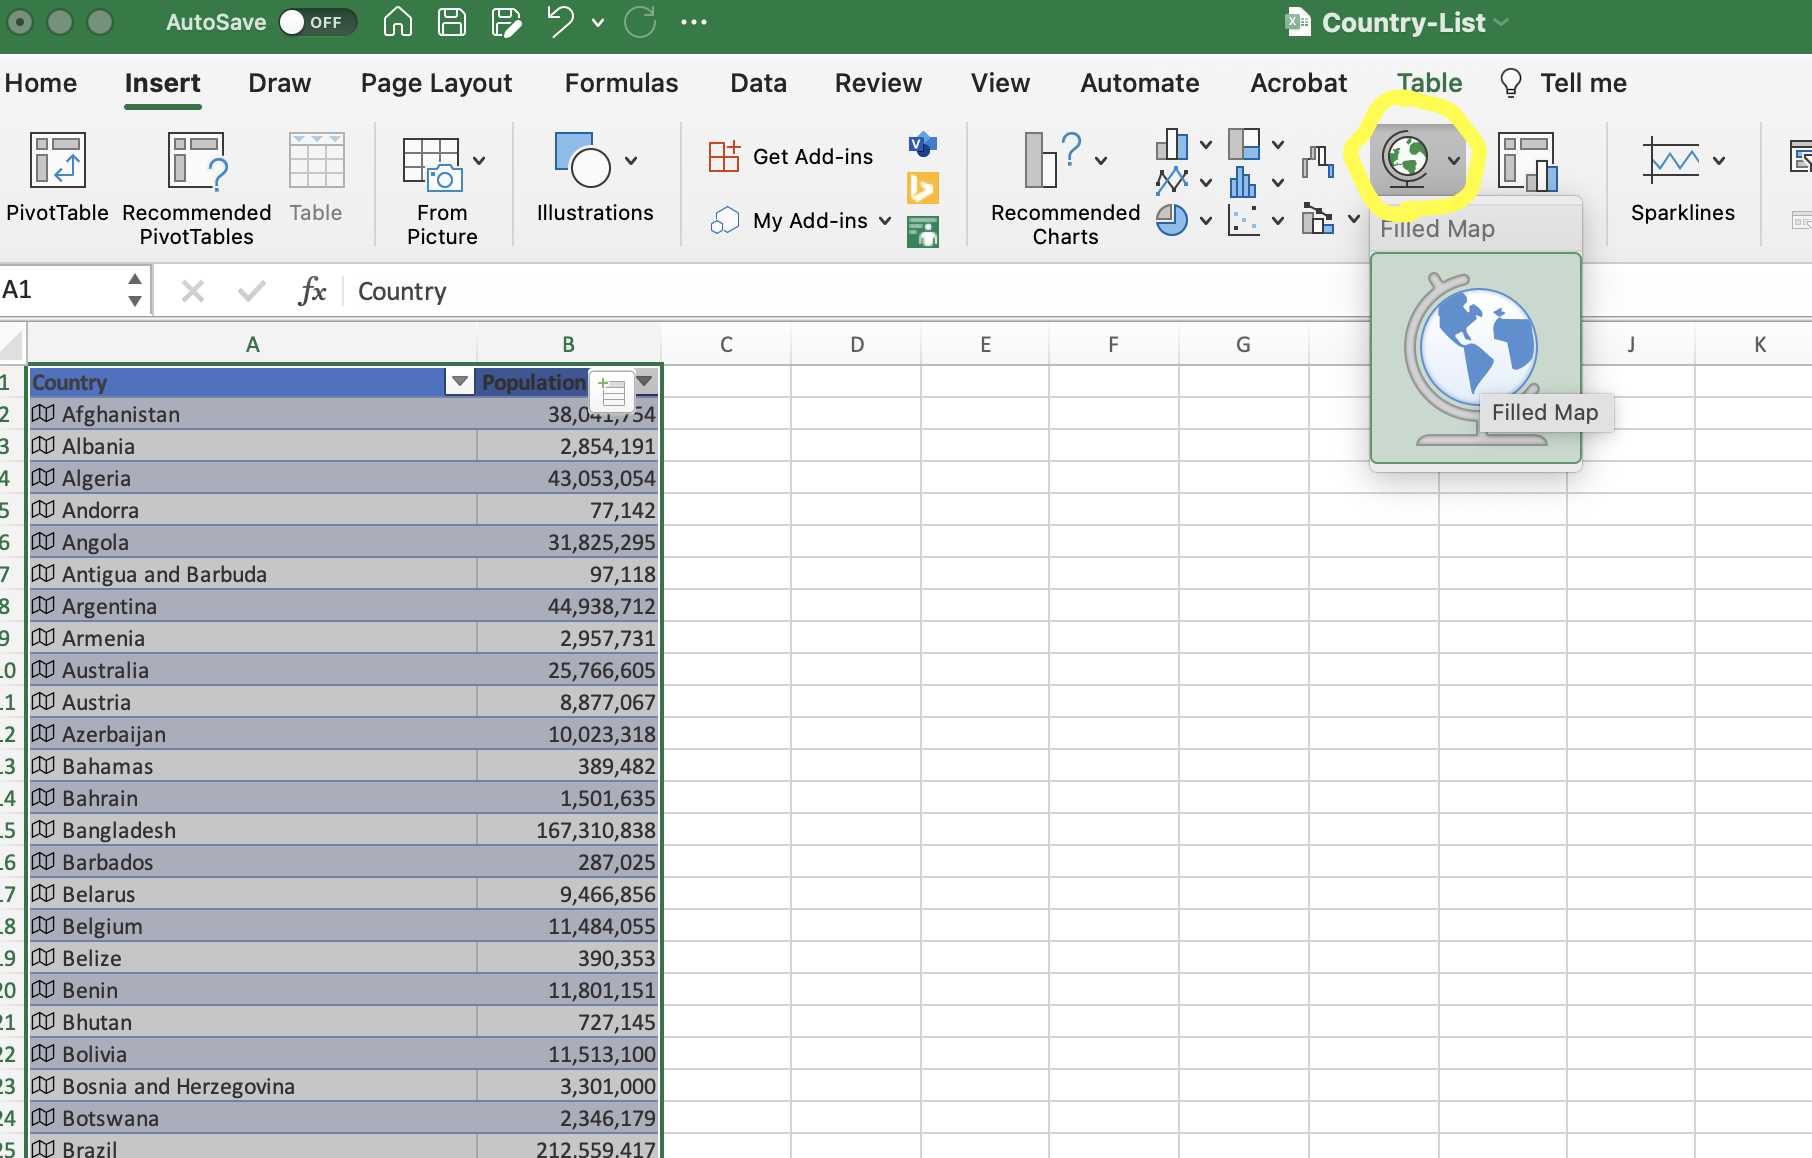
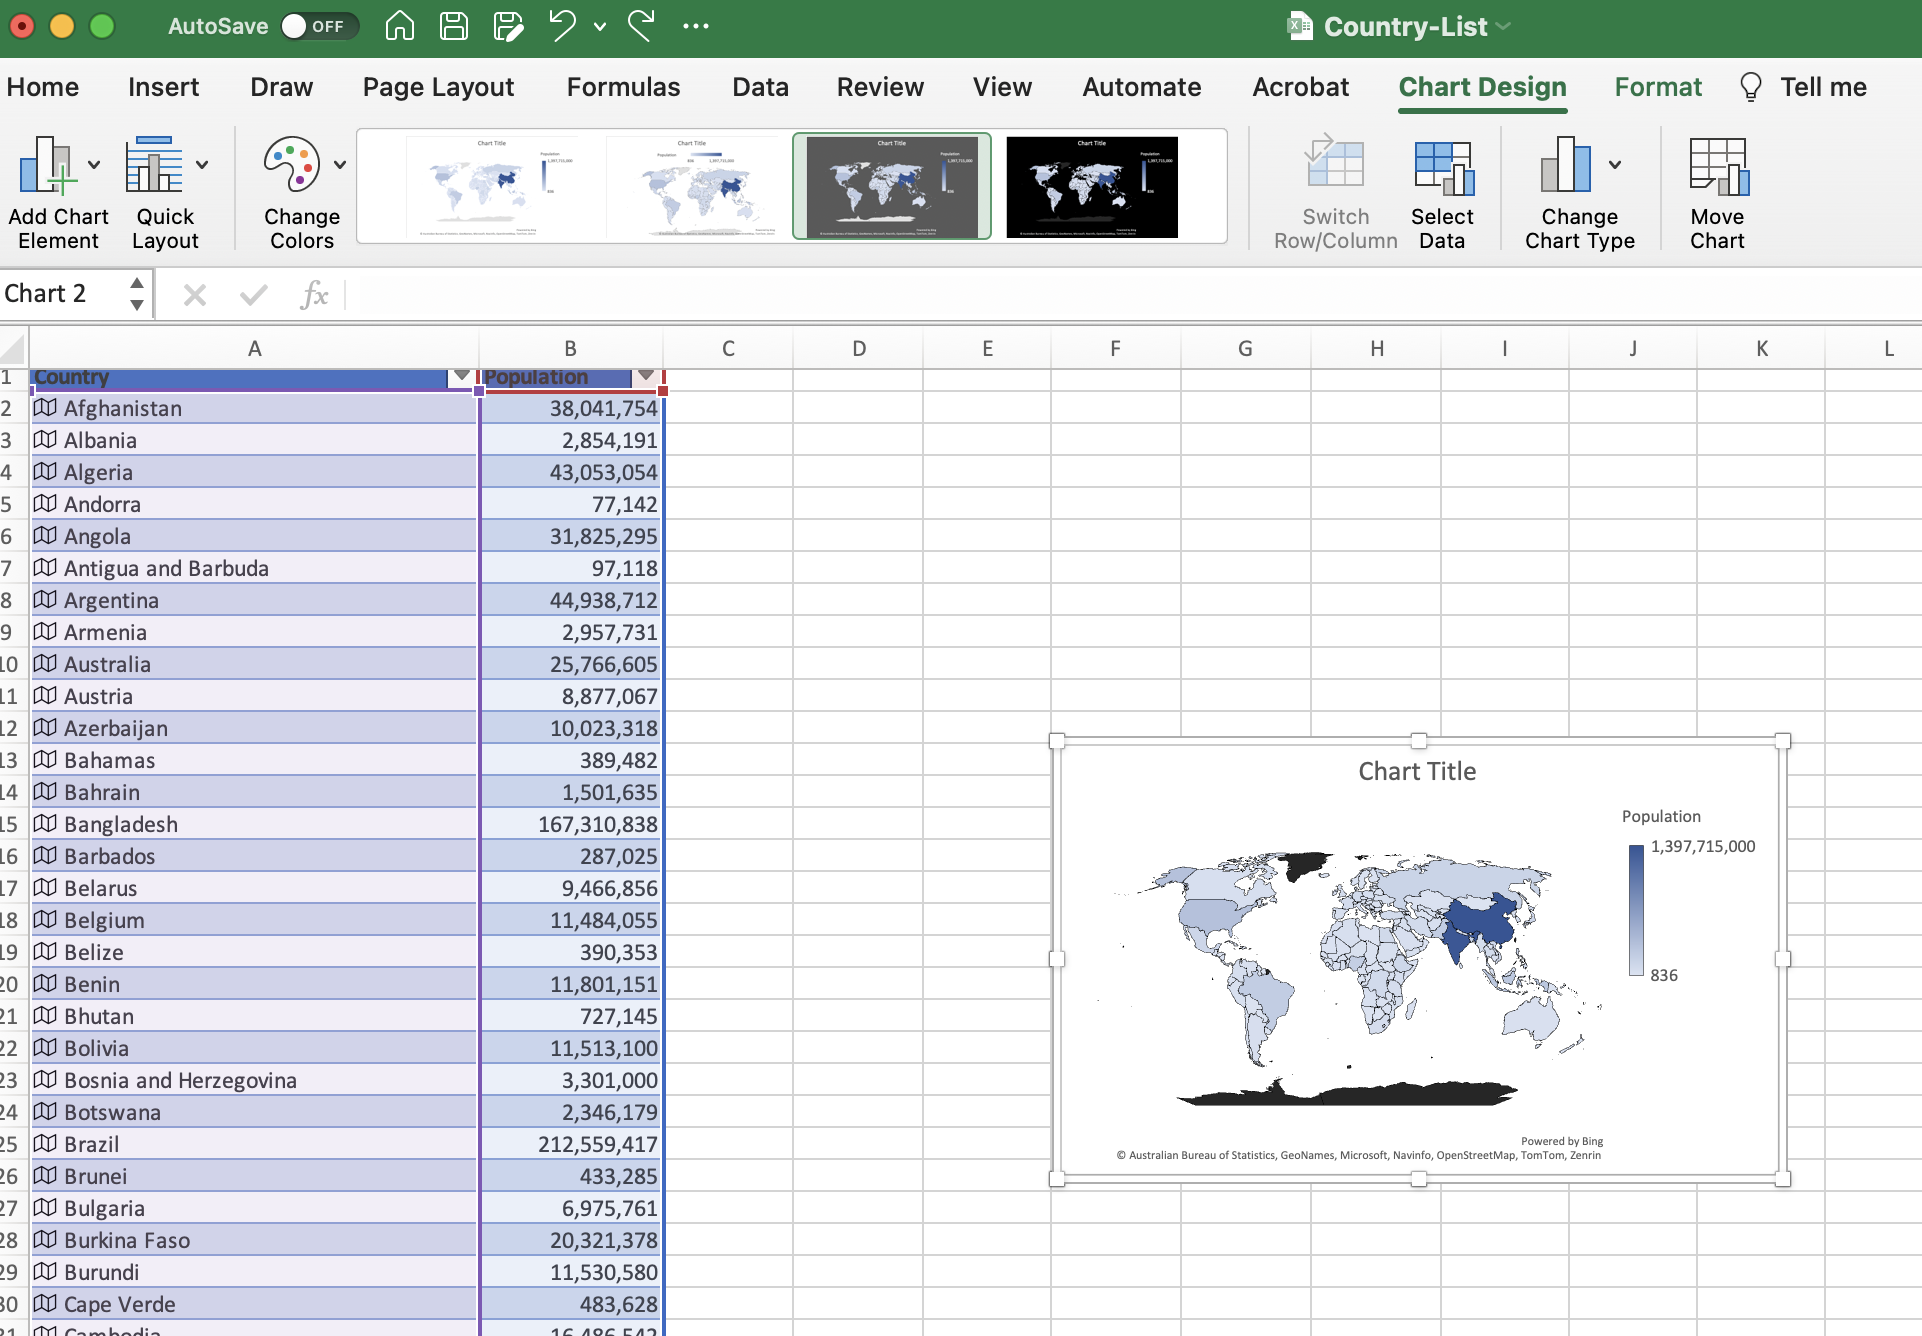
From here you can add columns with additional information. Notice the small menu icon will still be at the top. If you do not see it, move your cursor over the heading for “Population” and click. You can also just make an interactive Geo-Chart with the population data. To create a chart, select all the data in columns A and B so it is highlighted, then go to Insert, Maps, and Insert Map Chart.
Your next step will look like this. Select Insert, then Maps. In Windows you will see a list.
The result should look something like this. From here you can change the Chart Title, move the Chart, resize the Chart, and completely customize it.
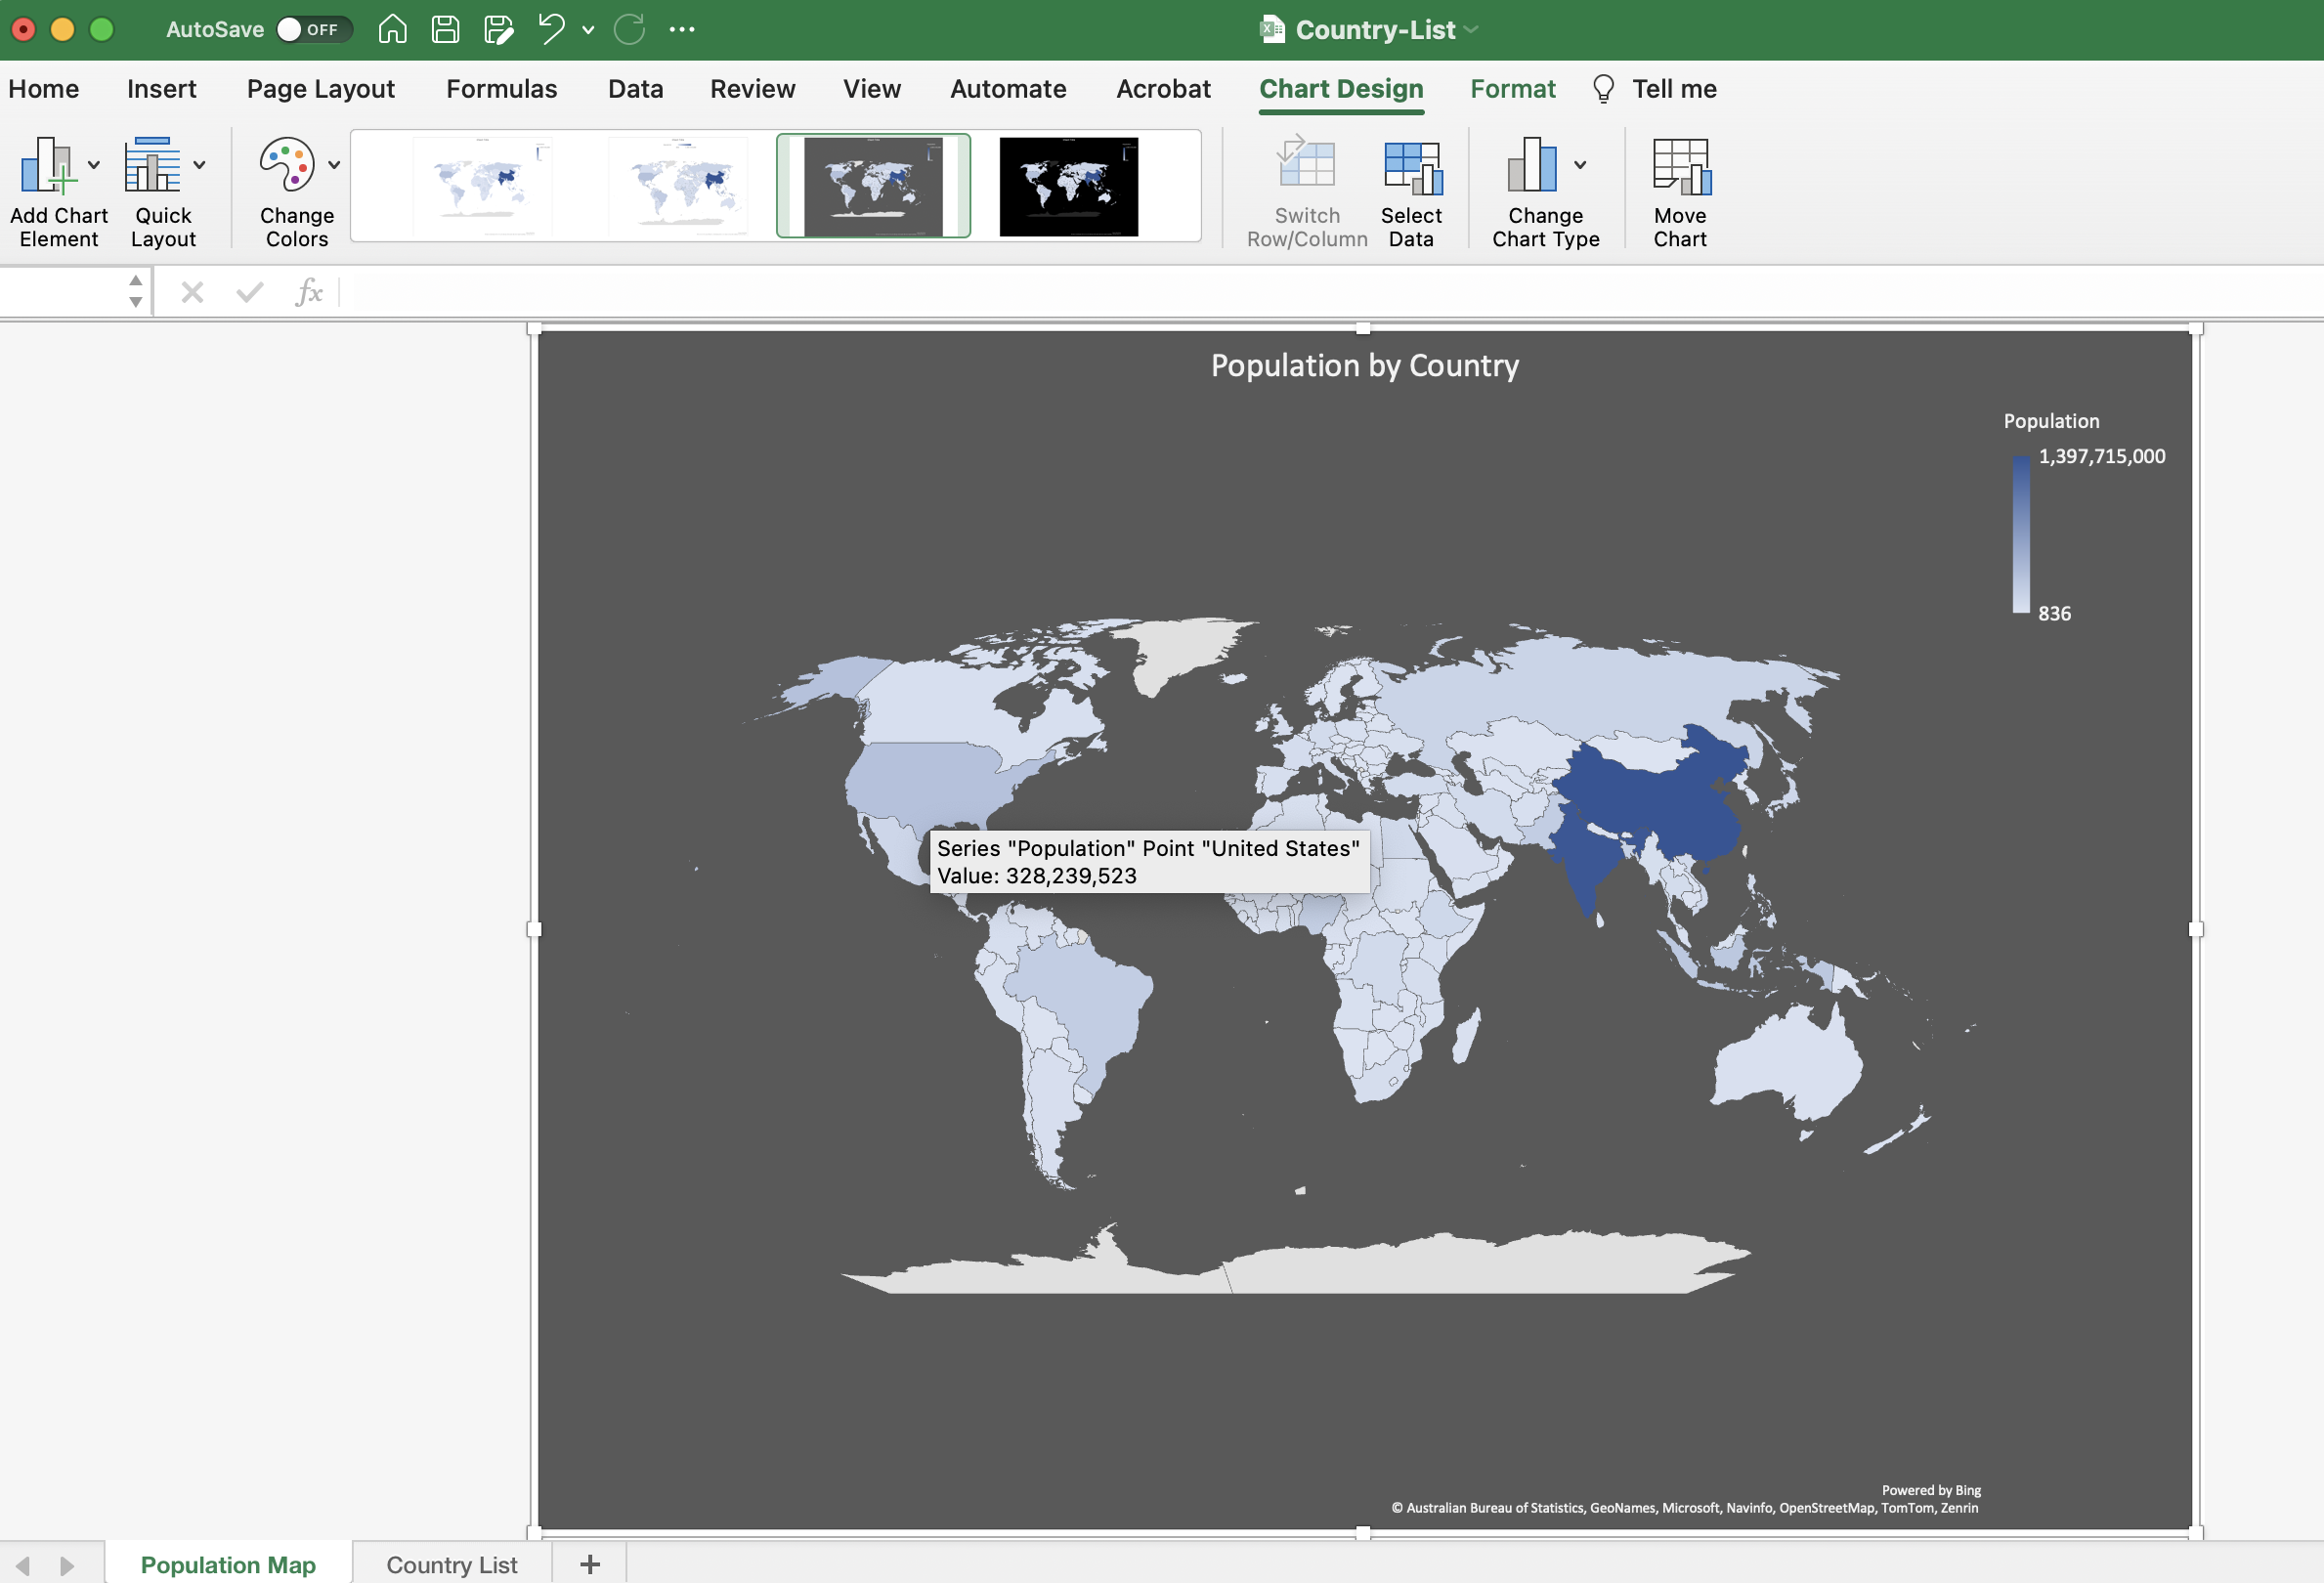
In this example, we moved the chart to it’s own sheet, changed the title, and changed the colors. Here is the result. Moving the cursor over the map reveals the population for that country.
Do not worry if you do not have a lot of Excel experience. Students pick it up quickly, and there are many sources of free tutorials. Possible assignments or presentations could include all data points for one Country, or one data point for all Countries or a region. I advocate introducing students to Excel, Numbers, or Google Sheets at an early age. I have taught Excel to 3rd Graders by showing them it can add big numbers automatically, and they can change the color of each cell. Following are some excellent free resources for you and your students to learn Excel:
Microsoft Excel Video Training